
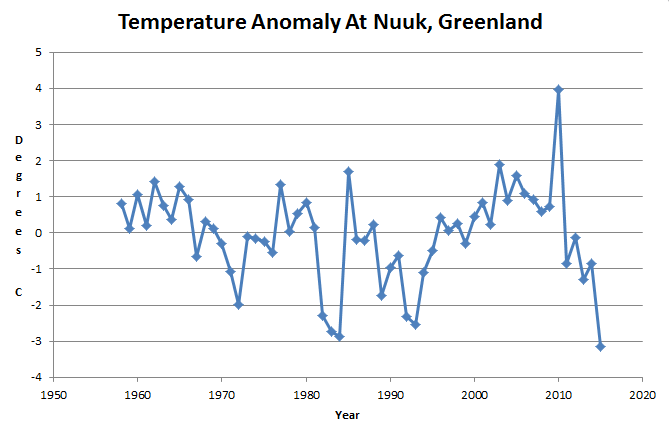
Southwest Greenland is having their coldest year on record – even colder than the years after the eruptions of El Chichon and Mt. Pinatubo.
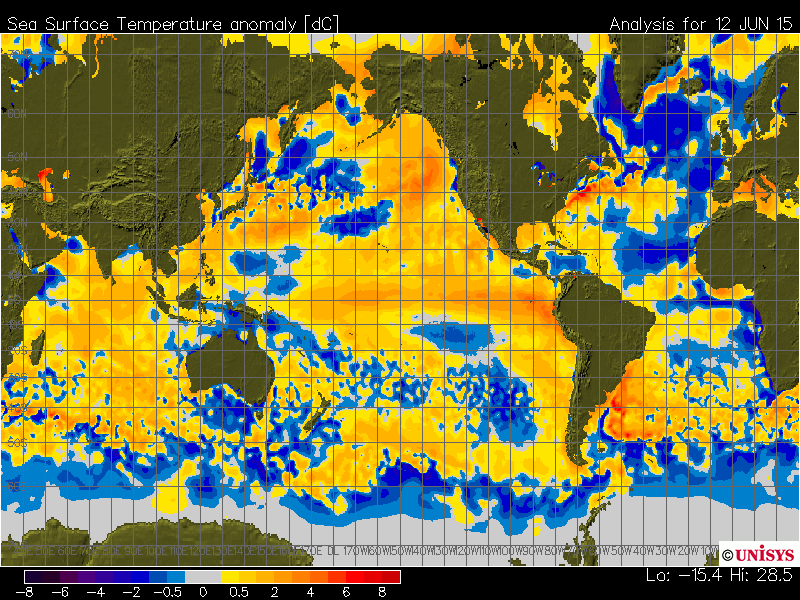
This is due to very cold water in the North Atlantic
Vikings farmed in Southern Greenland 1,000 years ago, but the climate is too cold now for outdoor farming.

Record Ice is not only in Greenland… even in the dead heart desert areas of Australia there is some by chance: http://www.abc.net.au/news/2015-06-14/winter-wonderland-in-the-red-centre-as-hail-transforms-desert/6544518
…
This amount of ice is unusual at this time of year… interesting to see what Winter brings in OZ.
Also , Australia has had the Coldest start to Winter in 40 years :
http://www.dailymail.co.uk/news/article-3109019/A-foot-snow-hits-parts-Australia-country-hit-lowest-temperatures-40-years-winter-begins.html
Steven, what do you make of THIS:
http://dailycaller.com/2015/06/15/americas-most-advanced-climate-station-data-shows-us-in-a-10-year-cooling-trend/
I’ve been saying that for over a year since I did a quick Excel calc on the data from the link below
http://www.ncdc.noaa.gov/temp-and-precip/national-temperature-index/time-series?datasets%5B%5D=uscrn¶meter=anom-tavg&time_scale=p12&begyear=2005&endyear=2015&month=6
At the moment, I make it that USCRN has a cooling trend of 0.32ºF/decade.
note; the value on the page you link is 0.002678ºF/month so x 120 = 0.321…. check 🙂
Interestingly, If you grab the USHCN data that ends on August last year, because it doesn’t have those last few months of slightly warmer anomalies, it is cooling at 0.9ºF/decade
The USCRN value is very close to that of RSS over the same period (-0.34ºF/decade)
Unexpected snowploughing to rescue car drivers in Sweden on 12 June:
http://sverigesradio.se/sida/artikel.aspx?programid=2054&artikel=6188767
The news article has a link to a video clip on their facebook page
From 1985 to 2010, AMO has caused a temperature increase of more than 0.4 degree C !!!
http://woodfortrees.org/graph/esrl-amo/from:1985/to:2011/trend/plot/esrl-amo/from:2010/trend/plot/esrl-amo/from:1980/plot/none
This rapid decline in AMO (with a decrease in solar activity) bodes ill for the winter for Europe and the eastern US.
Thank you, ren, for returning attention to the fountain of energy at the core of the solar system that religious fanatics have tried to hide from the public since first reported by Copernicus in 1543.
http://weather.gc.ca/data/saisons/images/2015061400_054_G6_global_I_SEASON_tm@lg@sd_000.png
Even the UK Met Office, is pointing to a severe Northern Winter ; blaming El-Nino,
of course this maybe their excuse for the “pause” in Global Warming (now Cooling).
http://www.dailymail.co.uk/sciencetech/article-3089657/Brace-snowstorms-freezing-temperatures-Met-Office-confirms-fears-El-Nino-cause-harsh-winter-Europe.html
“Even the UK Met Office, is pointing to a severe Northern Winter ”
Ahhhh.. so there’s a good chance it will be quite mild ! 🙂
How true!
Yes Andy ; UK Met Office has a history of reporting the opposite… I wonder if anyone, has done any stats’,, on what percentage the UK Met get it right ?
So how come there’s no “pause” in warming of the oceans? Look at ARGO recently…
The Argo buoys are still extremely sparse, and the error margin is way understated.
The ARGO change of ocean temperature for the whole world is something like 0.03C with +/- fluctuations of 0.02C.. and you seriously think this is measurably significant ??
really?? seriously??
Sorry, little non-science child-mind, but there is NO measurable significant warming of the world’s oceans why do you think they have to state it in Joules with a large index (hint.. to suck dopes like you in)
And when you compare even what has been supposedly measured, against the climate model predictions, ..
then its time for a good chuckle 😉
http://jonova.s3.amazonaws.com/graphs/ocean/global-ocean-temperature-700m-models-argo.gif
ps, It should also be noted that the original UKMO EN3 ocean data showed a slight insignificant COOLING trend.
But somehow NOAA’s “adjusted” data that shows a slight insignificant warming trend.
Who woulda guessed , hey 😉
https://bobtisdale.files.wordpress.com/2013/03/04-argo-era-raw-v-adjusted-ohc.png?w=1920&h=1248
pps…… and quoting R Scmitt (Woods Hole Oceanographic) and K Trenberth..
“With ocean heat content data before the ARGO era, the measurements are so sparse we are unable “to observe the motions of thermal anomalies in the mid- and high latitude oceans”, and since the introduction of the ARGO floats, there are “issues of missing and erroneous data and calibration”. Phrased other ways: ocean heat content is not a reliable dataset—and—it’s not a dataset in which we should have confidence.”
I would like to learn more about these anomalies and why they happen. Another one was the one from 1918, known as the Heating from Spitsbergen, which is explained here: https://rclutz.wordpress.com/2015/06/08/spitsbergen-triangle-ground-zero-for-climate-mysteries/
In 1917 and 1918 was the peak of the solar cycle 15, stronger than the 14 and 16, as well as the current 24.
http://www.solen.info/solar/cycl15.gif
http://www.solen.info/solar/images/comparison_similar_cycles.png
It can be seen also in the graph AMO.
http://woodfortrees.org/graph/esrl-amo/from:1850/to:1950
Reblogged this on Climatism.
The AMO shifting to a “cold” phase is something we haven’t been able to witness in the modern age of satellites and buoys, as it last did so before we had such gadgets. We should expect some surprises. One thing I imagine we will see is icebergs able to penetrate further south, simply because the water is colder.
Icebergs confuse the situation, by refusing to sink despite being cold. A lot of the cold water coming down from the arctic sinks from sight (unless it is close to shore over more shallow water) and therefore cannot effect air temperatures. There are fairly well understood down-welling zones, but when a bunch of icebergs arrives they don’t sink at the down-welling zone. They continue on their merry way, utterly screwing up all my careful calculations.
If the area of ice is very large, it can so chill the north Atlantic that Europe is effected, Our host posted on one such event here: https://stevengoddard.wordpress.com/2013/07/09/1816-shock-news-18000-square-miles-of-ice-broke-away-from-greenland/
There is currently a weakening storm up in Barents Sea which has shoved some ice south through Fram Strait. Surely some of our Alarmist friends are hoping this export of ice means we are in for a summer like 2007, when so much ice was exported we achieved our second-lowest minimum extent. However back then the AMO was warm, and now it is cold. The ice likely will linger longer and contribute to the cold AMO, and may even counter the warming of the atmosphere expected to come from the current El Nino. It will be interesting to watch, but at the very least it looks like things will stay cold in Greenland.
https://sunriseswansong.wordpress.com/2015/06/11/arctic-sea-ice-a-barents-sea-blaster/
What is interesting AMO is not directly related to solar cycles, but you can see the relationship with the cycle of the polar vortex (exactly 60 years).
“Our previous study showed that the response of tropospheric pressure to variations of solar activity (SA) and galactic cosmic ray (GCR) fluxes reveals a regional structure determined by the positions of the main climatic atmospheric fronts, as well as it strongly depends on the epochs of the large-scale circulation [Veretenenko and Ogurtsov, 2012]. In the epochs of increasing intensity of the meridional circulation (the form C according to Vangengeim-Girs classification [Vangengeim, 1952; Girs, 1974]) an increase of GCR
fluxes at minima of the 11-year cycle is accompanied by an intensification both of extratropical cyclones at Polar fronts of middle latitudes and Arctic anticyclones at high latitudes of the Northern hemisphere, as well as by a weakening of the equatorial trough at low latitudes. In the epochs of decreasing meridional circulation the troposphere response to SA/GCR variations reveals a similar regional structure, i.e., the
regions of most pronounced effects are closely related to the climatic atmospheric fronts, but the sign of SA/GCR effects in these regions is opposite.
It was also detected [Veretenenko and Ogurtsov, 2012] that the evolution of the meridional circulation is characterized by a roughly 60-year periodicity which, in turn, influences the sign of SA/GCR effects on troposphere pressure. Indeed, the reversals of the correlations between sea-level pressure at high latitudes and sunspot numbers occurred in the 1890s, the early 1920s, 1950s and the early 1980s and coincided well
with the changes in the evolution of the C-type meridional circulation. Hence, the aim of this work is to study what processes may influence the evolution of the large-scale circulation and, then, the character of SA/GCR effects on troposphere pressure.”
http://geo.phys.spbu.ru/materials_of_a_conference_2012/STP2012/Veretenenko_%20et_all_Geocosmos2012proceedings.pdf
Thanks
The papers REN digs up are always worth looking at.
Europe is affected …
Cool down with the propaganda, outdoor farming happens in Greenland also today:
http://www.greenland.com/en/articles/visit-greenland-s-banana-coast/
The house the stock for most of the year., and import most of the food for that stock from Denmark. Vikings actually GREW their stock food there, before the LIA hit.
We are still only a tiny molehill out of that LIA, only just above the COLDEST period in the whole of the current Holocene interglacial.
Perhaps several years ago…no farming going on today. Ground is still very much frozen.
cfgj …. twit – u go there and plant some bananas and then get back to us about how it goes …. the stupidity of some is mind boggling.
cfgj is a typical city type. Even after the snow finishes melting you have to wait until the ground warms up to around 50°F for many crops like corn. Other wise the seed just rots in the ground.
One old farmer who never lost a crop, was asked how he knew when it was time to plant. He told the questioner that he waited until the kids fishing on the river sat instead of stood to fish. Then he knew the ground was warm enough for the seed to sprout quickly and not rot.
On the other end is the first day of frost. If there are too few days between the ground being warm enough to plant and the first frost then the crop will not ripen. Even something as simple as hay needs enough days to grow to mowing height and enough warm days to cure. I am in the sunny south and we FINALLY got our first cutting of hay in. The corn is still only ankle high.
Every time I used to mention “There was a reason they called it “Greenland, not Iceland” AGW people pointed out that calling it “Greenland” was a PR stunt.
Now we have someone using PR propaganda from basically the Greenland Chamber of Commerce (BE A PIONEER!!) as evidence insinuating that bananas grow on the balmy coast. And calling the other side’s arguments propaganda.
You just can’t make stuff like this up. Well … I guess they can.
The world temperature map shows Hudson Bay as warmer than usual…and MORE THAN HALF OF IT IS STILL FROZEN!!!
You can see further cooling of the North Atlantic. Cool in Spain. In Greenland and Scandinavia mountains going to snow.
http://earth.nullschool.net/#current/wind/isobaric/850hPa/overlay=temp/orthographic=-74.92,59.85,688
A strong jet stream in the lower stratosphere shows that El Niño is weakening and monsoon increases.
http://earth.nullschool.net/#current/wind/isobaric/70hPa/orthographic=-149.99,2.10,454
http://earth.nullschool.net/#current/wind/isobaric/10hPa/orthographic=-207.49,1.51,344
SOI clearly on the rise.
https://www.longpaddock.qld.gov.au/seasonalclimateoutlook/southernoscillationindex/30daysoivalues/
Wind speeds due to the impact of the polar vortex. Here, the height of 27 km.
https://i2.wp.com/upload.wikimedia.org/wikipedia/commons/thumb/7/7c/Atmospheric_Transmission.png/595px-Atmospheric_Transmission.png
The first two absorption bands of CO 2 is approx. 2μm and 2,8μm (Figure 2). This radiation emitted by the sun. The earth does not emit waves in this regard. Absorbing agents reduce the amount of solar radiation reaching the Earth’s surface in these bands, which play a role similar to ozone and ultraviolet absorber protects the Earth from an excess of these emissions. The amount of energy that can absorb CO2 in these areas can be estimated at around 4% of the total capacity to absorb carbon dioxide.
Another extent of absorption of CO 2 is 4 – 4,5μm. The earth emits a minimal amount of radiation. These are the waves on the border of frequency emitted by the planet’s surface. Partly scope of this goes beyond earthly emissions. The graphs depicting the amount of radiation emitted by the Earth, we see an almost horizontal line by selecting the emission of energy at this wavelength. In this range, carbon dioxide absorbs about 8% of the total amount of infrared which is able to absorb. Due to the fact that the absorption in this band is only a fraction of CO 2 absorption capacity, and also extremely small is the same infrared source at this frequency can not be considered the significance of the absorption climate because it is the interaction too slim and perhaps trace.
Fourth clearly indicated on said graph (Figure 2), an absorption band, the scope of the biggest infrared absorption by carbon dioxide. It includes a wavelength of about 14μm to 18μm, so it is very large, and in addition to a large amount of radiation – in this field is absorbed approx. 88% of the total absorbed by CO 2 radiation. Infrared absorption peak for CO 2 falls to about 15μm, as shown in the following figure (Figure 3). It is in this fairly large absorption band environmentalists see their greatest source of influence on the climate. It does not surprise me, personally, because they have to search some data to confirm their theories. It seems that this is the proof – a large band of infrared absorption, but again this is proof perverse. What matters is because no amount of radiation, but its quality, that is the real power of influence. We are dealing here with radiation of high wavelength, and the greater the wavelength the less energy. By means of such radiation will not change in any significant way temperature, and partly because these wavelengths are not applicable in heating. There frequencies used bordering with visible light (from 0,78μm) and slightly larger wavelength, but those larger than 10μm did not play a role here (although they are present there, because the filaments of infrared radiators emit large range of wavelengths). Devoted by the atmosphere part of such radiation is certainly not lead to a significant increase in the Earth’s surface temperature and will not increase the average temperature of the atmosphere.
Known, perverse slogan of environmentalists is the identification of these wavelengths from the microwave and creating associations with microwave, which is a complete mistake, calculated on the ignorance of readers. The difference between microwaves and infrared is in fact fundamental. Microwaves, is composed of electron radiation, and infrared light particles or photons – particles of very different energy. Their frequency of overlap, as is the case with many other types of radiation, but their essence is fundamentally different.
“The amount of energy that can absorb CO2 in these areas can be estimated at around 4% of the total capacity to absorb carbon dioxide.”
Grammatical and scientific nonsense. Energy does not absorb any gases.
The message is clear.
REN does not speak or write English. That is most likely a google translate or his efforts to communicate.
It is also the longest piece I have ever seen REN try to write so do not bash him for attempting to ‘climb a mountain’. (I am really good at completely mangling three languages, French, German and Spanish. Even my husband cringes.)
Amen!
Despite language barriers, ren understands Earth’s climate better than most.
I can assure you it’s bloody cold here in England! Winter duvet still on the bed, wife needs her hot water bottle to warm here feet in bed too! Flaming June?
According to measurement the seas are warming up without hiatus (ARGO) and consequently also rising, without a pause (satellite altimeter). This has created the need to deny these measurements and claim that they are “doctored”. The truth is you cannot handle the truth?
I repeat, because your diminutive mind doesn’t seem to comprehend the first time.
quoting R Scmitt (Woods Hole Oceanographic) and K Trenberth..
“With ocean heat content data before the ARGO era, the measurements are so sparse we are unable “to observe the motions of thermal anomalies in the mid- and high latitude oceans”, and since the introduction of the ARGO floats, there are “issues of missing and erroneous data and calibration”. Phrased other ways: ocean heat content is not a reliable dataset—and—it’s not a dataset in which we should have confidence.”
Oh yes, lets just ignore inconvenient data – very scientific!
And how come the oceans are rising, or has that data been faked too? 😀
The oceans have been rising at a steady rate since well before CO2 could have had any effect. There has been NO acceleration. That is what the data tells us.
And yes, there is a LOT of dispute about the if sea level is rising or not.
Dispute by some of the world’s foremost oceanographers.
http://joannenova.com.au/2012/12/are-sea-levels-rising-nils-axel-morner-documents-a-decided-lack-of-rising-seas/
You do know that the land gauges that the satellite data is calibrated against have been shown to be sinking, don’t you?
Tide gauges that have very stable geography positioning are showing around 1.2mm/year.
Sydney for example has a sea level trend of 0.65mm/year, over a quite long time period, with NO ACCELERATION.
When will you wake up and realise that there is ZERO effect from any supposed CO2 ocean warming. It is a myth, a fallacy. !
And again, putting the tiny amount of natural, non-accelerating sea level rise against the “predictions” of the rabid alarmist priests, that you seem to worship, really makes them look like moronic fools.. you are heading down that path too.
Unquestioning zombie-like, brain-dead belief is all you have.
Nor does anyone have to “invent” a claim of adjustment.
Just compare the UK data to the NODC data
https://bobtisdale.files.wordpress.com/2013/03/04-argo-era-raw-v-adjusted-ohc.png?w=1920&h=1248
Then compare to the model projections , and roll on the floor laughing .
So how come the paranoid-camp is unable to publish a rebuttal in a peer-reviewed journal? Conspiracy again?
Who needs a peer review when they ADMIT they were wrong when caught?
A couple of links for you to read, child-mind.
http://jennifermarohasy.com/2008/11/correcting-ocean-cooling-nasa-changes-data-to-fit-the-models/
Oh , and you need to get up to date.
Since 2003, the oceans have been cooling.
http://blog.drwile.com/wp-content/uploads/2009/08/argo_temps.jpg
Quote from Josh Willis of NASA’s Jet Propulsion Laboratory.. the guy who looks after the ARGO data.. and was earlier caught admitting to making adjustments…..
“There has been a very slight cooling, but not anything really significant”
That is BS, the oceans have been rising the whole time which does not fit together with the claim that the oceans are cooling. BTW, could you rely less on non peer-reviewed and therefore quite unreliable claims? Anything can be stated in a blog with no consequences…
Ignoring the data , again, I see.
that is what you do, that is all you can do.
Do not under any circumstances let reality penetrate that brain-wash grey sludge inside your thick non-thinking cranium
•The RAW data from the TOPEX/POSEIDON sea-level satellites, which operated from 1993-2000, shows a slight uptrend in sea level. However, after exclusion of the distorting effects of the Great El Niño Southern Oscillation of 1997/1998, a naturally-occurring event, the sea-level trend is zero.
•The GRACE gravitational-anomaly satellites are able to measure ocean mass, from which sea-level change can be directly calculated. The GRACE data show that sea level FELL slightly from 2002-2007.
Actually GRACE only measures gravity anomalies, and nothing else.
roflmao.. now going down the pal-review façade.. dig a deep hole for that one. !
Its very funny that you think that pal-review in climate science makes a paper “reliable”.
I bet you think places like the Maldives are actually experiencing sea level rise?
You believe the fakery?
Seems that the people in the Maldives have other ideas..
https://notalotofpeopleknowthat.wordpress.com/2015/06/16/the-maldives-latest-airport/
It must be very hard for you when even the most rabid alarmist institutes are admitting a “pause” in temperatures since 1998..
Oh dear, you poor child, your belief structures, trashed.. next the Easter bunny !!!!
http://notrickszone.com/2015/06/16/max-planck-institute-confirms-warming-pause-and-scrambles-to-explain-widespread-model-failure/#sthash.4hqfD17N.Au71kRDR.dpbs
And some more reading, just for you..
http://jennifermarohasy.com/2008/11/correcting-ocean-cooling-nasa-changes-data-to-fit-the-models/
So according to an unpublished online pamphlet, NASA is falsifying data? Yeah, right.
Not “inconvenient”. Just inaccurate and very incomplete. Guess if the gas gauge on you fuel tank remains on full after 200 miles of driving your one of those that will think you still have a full tank!
Yea, like NASA GISS has never been proven to have made fraudulent temperature claims?
g/newspaper-article/2009/01/01/warmest-october-claim-was-wrong-nasa-admits
“NASA’s Goddard Institute for Space Studies—known as GISS—was forced to admit it committed an egregious error when it publicly claimed October 2008 was the warmest October in history.”
http://wattsupwiththat.com/2010/03/30/nasa-data-worse-than-climate-gate-data-giss-admits/
“NASA Data Worse Than Climate-Gate Data, GISS Admits”
http://www.breitbart.com/big-government/2011/05/13/nasa-gets-caught-faking-climate-change-data-again/
“NASA Gets Caught Faking Climate Change Data-AGAIN!”
And a graph showing just how quickly the Arctic is COOLING relative to tiny insignificant warming trend elsewhere.
https://bobtisdale.files.wordpress.com/2014/10/figure-2-comparison-w-arctic.pngtrend
Don’t let “the science” bite you on the a*** on the way out, chump !
Warming seas are also undergoing thermail expansion, without any pause:
http://www.aviso.altimetry.fr/fileadmin/images/data/Products/indic/msl/MSL_Serie_MERGED_Global_IB_RWT_GIA_Adjust.png
Do you ever learn?
Sea level budget over 2005–2013: missing contributions and data errors
H. B. Dieng1, A. Cazenave1, K. von Schuckmann2, M. Ablain3, and B. Meyssignac1
1Laboratoire d’Etudes en Géophysique et Océanographie Spatiales – Centre National d’Etudes Spatiales (LEGOS – CNES), Toulouse, France
2Mediterranean Institute of Oceanography (MIO), Université de Toulon, Toulon, France
3Collecte Localisation Satellites (CLS), Ramonville, France
Abstract. Based on the sea level budget closure approach, this study investigates the residuals between observed global mean sea level (GMSL) and the sum of components (steric sea level and ocean mass) for the period January 2005 to December 2013. The objective is to identify the impact of errors in one or several components of the sea level budget on the residual time series. This is a key issue if we want to constrain missing contributions such as the contribution to sea level rise from the deep ocean (> 2000m). For that purpose, we use several data sets as processed by different groups: six altimetry products for the GMSL, four Argo products plus the ORAS4 ocean reanalysis for the steric sea level and three GRACE-based ocean mass products. We find that over the study time span, the observed trend differences in the residuals of the sea level budget can be as large as ~0.55mm yr−1. These trend differences essentially result from the processing of the altimetry data (e.g., choice the geophysical corrections and method of averaging the along-track altimetry data). At short time scale (from sub-seasonal to multi-annual), residual anomalies are significantly correlated with ocean mass and steric sea level anomalies (depending on the time span), indicating that the residual anomalies are related to errors in both GRACE-based ocean mass and Argo-based steric data. Efforts are needed to reduce these various sources of errors before using the sea level budget approach to estimate missing contributions such as the deep ocean heat content.
You keep spouting garbage. Enough already.
What is your point? Nothing in that post implies that altimeters do nt detect a (rather stable) sea level rise.
Try reading the post again.
We find that over the study time span, the observed trend differences in the residuals of the sea level budget can be as large as ~0.55mm yr−1. These trend differences essentially result from the processing of the altimetry data (e.g., choice the geophysical corrections and method of averaging the along-track altimetry data). At short time scale (from sub-seasonal to multi-annual), residual anomalies are significantly correlated with ocean mass and steric sea level anomalies (depending on the time span), indicating that the residual anomalies are related to errors in both GRACE-based ocean mass and Argo-based steric data. Efforts are needed to reduce these various sources of errors before using the sea level budget approach to estimate missing contributions such as the deep ocean heat content.
GRACE also does not measure sea levels, it measures gravity anomalies, and gravity changes over time and location.
To understand science, you must be able to read more than graphs.
“Does he ever learn?”
NOPE.. he is brain-washed, a non-thinking drone. Incapable of learning.
Reality cannot penetrate the grey mush.
oh look.. even the fudged data shows ZERO acceleration.
Therefore no extra warming signal from raised atmospheric CO2
AGW.. BUSTED again !!!
There’s no pause either. The planet has been warming up all the time and the tools who are talking about a “hiatus” are BUSTED!
There was never a “hiatus”…. that was the word the modeller and climate alarmists used first.
It was actually stationary plateau/turning point.
The flat top of a molehill of slight warming from the LIA
The world is now in cooling mode.
Hate to tell you bud but the MET office (UK) finally admitted there was a pause so your lies do nothing but make you look like a lying propagandist or a brainless fool.
And straight from the MET OFFICE
Lots of spin of course as expected from those who must please their political masters, but they did admit there was a pause. Now however NASA/NOAA finds the pause to be inconvienent for Obama so it is down the memory hole we go, just like they did to the Global Cooling Scare in the 1970s.
You’re busted ” cfgj ” you remind me of some other rusted on fanatics, that couldn’t be woken up to the “reality”, even when every aspect of evidence was laid before them. Remember the “Ship Of Fools” ; you would have been perfect for that mission…
http://australian-news.net/articles/view.php?id=178
The rabid warmistas at “Thick as a Planck” have also admitted to the plateau. (although they call it a hiatus, as all warmistas do)
http://notrickszone.com/2015/06/16/max-planck-institute-confirms-warming-pause-and-scrambles-to-explain-widespread-model-failure/#sthash.E7jNOD21.dpbs
They also say that…. “Atlantic will cool down by several tenths of a degree by 2020…”
That’s an amazingly fast cooling rate, especially compared to the warming rate of 0.03C over a 20-30 year period that the child-mind is bleating about.
I’m assuming that Planck is being their normal imprecise dolts that they are, and actually mean the surface temperature.
These tools?
Dr. Phil Jones – CRU emails – 5th July, 2005
“The scientific community would come down on me in no uncertain terms if I said the world had cooled from 1998. OK it has but it is only 7 years of data and it isn’t statistically significant….”
Dr. Phil Jones – CRU emails – 7th May, 2009
‘Bottom line: the ‘ no upward trend’ has to continue for a total of 15 years before we get worried.’
__________________
Dr. Judith L. Lean – Geophysical Research Letters – 15 Aug 2009
“… This lack of overall warming is analogous to the period from 2002 to 2008 when decreasing solar irradiance also countered much of the anthropogenic warming…”
__________________
Dr. Kevin Trenberth – CRU emails – 12 Oct. 2009
“Well, I have my own article on where the heck is global warming…..The fact is that we can’t account for the lack of warming at the moment and it is a travesty that we can’t.”
__________________
Dr. Mojib Latif – Spiegel – 19th November 2009
“At present, however, the warming is taking a break,”…….”There can be no argument about that,”
__________________
Dr. Jochem Marotzke – Spiegel – 19th November 2009
“It cannot be denied that this is one of the hottest issues in the scientific community,”….” We don’t really know why this stagnation is taking place at this point.”
__________________
Dr. Phil Jones – BBC – 13th February 2010
“I’m a scientist trying to measure temperature. If I registered that the climate has been cooling I’d say so. But it hasn’t until recently – and then barely at all. The trend is a warming trend.”
__________________
Dr. Phil Jones – BBC – 13th February 2010
[Q] B – “ Do you agree that from 1995 to the present there has been no statistically-significant global warming”
[A] “ Yes, but only just”.
__________________
Prof. Shaowu Wang et al – Advances in Climate Change Research – 2010
“…The decade of 1999-2008 is still the warmest of the last 30 years, though the global temperature increment is near zero;…”
__________________
Dr. B. G. Hunt – Climate Dynamics – February 2011
“Controversy continues to prevail concerning the reality of anthropogenically-induced climatic warming. One of the principal issues is the cause of the hiatus in the current global warming trend.”
__________________
Dr. Robert K. Kaufmann – PNAS – 2nd June 2011
“…..it has been unclear why global surface temperatures did not rise between 1998 and 2008…..”
__________________
Dr. Gerald A. Meehl – Nature Climate Change – 18th September 2011
“There have been decades, such as 2000–2009, when the observed globally averaged surface-temperature time series shows little increase or even a slightly negative trend1 (a hiatus period)….”
__________________
Met Office Blog – Dave Britton (10:48:21) – 14 October 2012
“We agree with Mr Rose that there has been only a very small amount of warming in the 21st Century. As stated in our response, this is 0.05 degrees Celsius since 1997 equivalent to 0.03 degrees Celsius per decade.”
Source: metofficenews.wordpress.com/2012/10/14/met-office-in-the-media-14-october-2012
__________________
Dr. James Hansen – NASA GISS – 15 January 2013
“The 5-year mean global temperature has been flat for a decade, which we interpret as a combination of natural variability and a slowdown in the growth rate of the net climate forcing.”
__________________
Dr Doug Smith – Met Office – 18 January 2013
“The exact causes of the temperature standstill are not yet understood,” says climate researcher Doug Smith from the Met Office.
[Translated by Philipp Mueller from Spiegel Online]
__________________
Dr. Virginie Guemas – Nature Climate Change – 7 April 2013
“…Despite a sustained production of anthropogenic greenhouse gases, the Earth’s mean near-surface temperature paused its rise during the 2000–2010 period…”
__________________
Dr. Judith Curry – House of Representatives Subcommittee on Environment – 25 April 2013
” If the climate shifts hypothesis is correct, then the current flat trend in global surface temperatures may continue for another decade or two,…”
__________________
Dr. Hans von Storch – Spiegel – 20 June 2013
“… the increase over the last 15 years was just 0.06 degrees Celsius (0.11 degrees Fahrenheit) — a value very close to zero….If things continue as they have been, in five years, at the latest, we will need to acknowledge that something is fundamentally wrong with our climate models….”
__________________
Professor Masahiro Watanabe – Geophysical Research Letters – 28 June 2013
“The weakening of k commonly found in GCMs seems to be an inevitable response of the climate system to global warming, suggesting the recovery from hiatus in coming decades.”
__________________
Met Office – July 2013
“ The recent pause in global warming, part 3: What are the implications for projections of future warming?
………..
Executive summary
The recent pause in global surface temperature rise does not materially alter the risks of substantial warming of the Earth by the end of this century.”
Source: metoffice.gov.uk/media/pdf/3/r/Paper3_Implications_for_projections.pdf
__________________
Professor Rowan Sutton – Independent – 22 July 2013
“Some people call it a slow-down, some call it a hiatus, some people call it a pause. The global average surface temperature has not increased substantially over the last 10 to 15 years,”
__________________
Dr. Kevin Trenberth – NPR – 23 August 2013
“ They probably can’t go on much for much longer than maybe 20 years, and what happens at the end of these hiatus periods, is suddenly there’s a big jump [in temperature] up to a whole new level and you never go back to that previous level again,”
__________________
Dr. Yu Kosaka et. al. – Nature – 28 August 2013
“ Recent global-warming hiatus tied to equatorial Pacific surface cooling
Despite the continued increase in atmospheric greenhouse gas concentrations, the annual-mean global temperature has not risen in the twenty-first century…”
__________________
Professor Anastasios Tsonis – Daily Telegraph – 8 September 2013
“We are already in a cooling trend, which I think will continue for the next 15 years at least. There is no doubt the warming of the 1980s and 1990s has stopped.”
__________________
Dr. Kevin E. Trenberth – Nature News Feature – 15 January 2014
“The 1997 to ’98 El Niño event was a trigger for the changes in the Pacific, and I think that’s very probably the beginning of the hiatus,” says Kevin Trenberth, a climate scientist…
__________________
Dr. Gabriel Vecchi – Nature News Feature – 15 January 2014
“A few years ago you saw the hiatus , but it could be dismissed because it was well within the noise,” says Gabriel Vecchi, a climate scientist…“Now it’s something to explain.”…..
__________________
Professor Matthew England – ABC Science – 10 February 2014
“Even though there is this hiatus in this surface average temperature, we’re still getting record heat waves, we’re still getting harsh bush fires…..it shows we shouldn’t take any comfort from this plateau in global average temperatures.”
__________________
Dr. Jana Sillmann et al – IopScience – 18 June 2014
Observed and simulated temperature extremes during the recent warming hiatus
“This regional inconsistency between models and observations might be a key to understanding the recent hiatus in global mean temperature warming.”
__________________
Dr. Young-Heon Jo et al – American Meteorological Society – October 2014
“…..Furthermore, the low-frequency variability in the SPG relates to the propagation of Atlantic meridional overturning circulation (AMOC) variations from the deep-water formation region to mid-latitudes in the North Atlantic, which might have the implications for recent global surface warming hiatus.”
__________________
Dr. Hans Gleisner – Geophysical Research Letters – 2015
Recent global warming hiatus dominated by low latitude temperature trends in surface and troposphere data
Over the last 15 years, global mean surface temperatures exhibit only weak trends…..Omission of successively larger polar regions from the global-mean temperature calculations, in both tropospheric and surface data sets, shows that data gaps at high latitudes can not explain the observed differences between the hiatus and the pre-hiatus period….
http://onlinelibrary.wiley.com/doi/10.1002/2014GL062596/abstract
__________________
==
Shuai-Lei Yao et al – Theoretical and Applied Climatology – 9 January 2015
The global warming hiatus—a natural product of interactions of a secular warming trend and a multi-decadal oscillation
….We provide compelling evidence that the global warming hiatus is a natural product of the interplays between a secular warming tendency…..
http://link.springer.com/article/10.1007/s00704-014-1358-x
__________________
H. Douville et al – 2015
The recent global-warming hiatus: What is the role of Pacific variability?
The observed global mean surface air temperature (GMST) has not risen over the last 15 years, spurring outbreaks of skepticism regarding the nature of global warming and challenging the upper-range transient response of the current-generation global climate models….
http://onlinelibrary.wiley.com/doi/10.1002/2014GL062775/abstract
__________________
Dr. Kevin E. Trenberth 11 July 2014
Seasonal aspects of the recent pause in surface warming
Factors involved in the recent pause in the rise of global mean temperatures are examined seasonally. For 1999 to 2012, the hiatus in surface warming is mainly evident in the central and eastern Pacific…….atmospheric circulation anomalies observed globally during the hiatus.
Unfortunately, the temperature in the lower troposphere falling since 1998 and will fall further. El Niño is weakening, and AMO decline. This is proof that CO2 does not work, because the CO2 is in the troposphere.
http://woodfortrees.org/plot/rss/from:1998/plot/rss/from:1998/trend
https://www.longpaddock.qld.gov.au/seasonalclimateoutlook/southernoscillationindex/30daysoivalues/
The rising seas are swamping no one. 🙂
The ‘rising seas’ are falling over the long term. Nothing like cherry picking your start dates. ClimAstrologists have a great future career as migrant workers ahead of them….
TEN PEER-REVIEWED STUDIES PROVING SEA LEVEL IS NOT RISING
The sea-level is rising at about 3mm/year globally. If you look at the graph I posted above the recent El Nino – related bulging is visible quite nicely. I’m looking forward to updates to the sea-level graphs.
The tide gauges say 1.2mm/year… (only the “adjusted” satellite record says 3mm/year.)
It has been rising at approximately the same rate since the LIA. 1-2mm/year
There is NO acceleration that would indicate any CO2 warming effect.
Just think, in 100 years that will be 120mm .. scary hey, bozo !!!
Do you really think mankind isn’t capable of coping with 120mm in 100 years.
Oh.. If they were all as brain-dead as you.. probably they wouldn’t.
I can make any data and any graph show exactly what I want it to. It is done all the time. I was fired three times because I refused to ‘Adjust the Data’ on certificates of analysis. I had knock down drag out fights with others at corporate wide meetings where it was decided to use a ‘Generally Accepted Value’ based on an average, instead of a carefully measured value based on measurements made on equipment and reference material from the National Bureau of Standards. (The company had been using uncalibrated thermometers in all plants and research labs and an internal standard made from production material. This made the ‘Generally Accepted Value’ way off from the NBS reference material but they were not about to admit it.)
The attacks on Willie Soon, Dr Salby and others show EXACTLY what will happen to a scientist who does not give the powerful the data they demand.
Princeton University Physicist Dr. Will Happer is another much earlier example. Dr. Happer has published over 200 peer-reviewed scientific papers and was a former Director of Energy Research at the Department of Energy from 1990 to 1993 but that did not keep Al Gore from firing him. “I had the privilege of being fired by Al Gore, since I refused to go along with his alarmism. I did not need the job that badly, I was told that science was not going to intrude on policy.” So Willie Soon is by no means the the first honest scientist targeted by the government.
(I had the honor of meeting Dr Happer and attending his lecture for Physics grad students.)
Oh and here is the Sea Temperature Chart from the EPA showing the Haitus in ocean temperatures. I am actually rather suprised it has not been ‘adjusted’ yet.
http://www.epa.gov/climatechange/images/indicator_figures/sea-surface-temp-figure1-2012.gif
This from another scientist who has been attacked for refusing to spew propaganda and call it science.
https://upload.wikimedia.org/wikipedia/commons/1/1e/Holocene_Sea_Level.png
Toss out the outlier at Santa Catarina in this already adjusted graph and you can see the sea level has fallen over the last thousand years in response to a COOLING CLIMATE.
And the Santa Catarina outlier is a very very data point.
Santa Catarina
The next question is Brazil tectonically stable?
The Brazilian Shield is tectonically stable. The last orogenic cycle to affect it occurred > 600 million years ago.
Here is the latest airport in the Maldives..
https://notalotofpeopleknowthat.files.wordpress.com/2015/06/1maldivess11.jpg
Just think, at 3mm/year , in 100 years that little black line near the water on the right hand end of the runway, will still be there… EVEN if nobody does anything to combat the horrific level of continued natural sea level rise.
Are you scared yet, child-mind ????
Since 2001, the satellite data gives a sea surface temperature trend of -0.027ºC/decade, and basically dead level since 2005
NASA itself says there is no warming below 2000m
How does zero warming on the surface and zero warming below 2000m manage to warm the ocean between the surface down to 2000m ?
Come on, explain if you can.. (this should be hilarious 😉 )
Awaiting a “magical” explanation. 🙂
Gail, the rock shelfs along the coast of Australia indicate that at some stage, the sea level was 1-2m higher than now. Similar to Brazil.
SST is the temperature of the top millimeter or so, sunlight warms up waters much deeper than that. The current El Nino shows up nicely in altimetric products:
http://bulletin.aviso.oceanobs.com/images/produits/indic/enso/maps/Msla_MoyMens_PacTrop_latest.png
To arrive at their conclusion, the JPL scientists did a straightforward subtraction calculation, using data for 2005-2013 from the Argo buoys, NASA’s Jason-1 and Jason-2 satellites, and the agency’s Gravity Recovery and Climate Experiment (GRACE) satellites. From the total amount of sea level rise, they subtracted the amount of rise from the expansion in the upper ocean, and the amount of rise that came from added meltwater. The remainder represented the amount of sea level rise caused by warming in the deep ocean.
The remainder was essentially zero. Deep ocean warming contributed virtually nothing to sea level rise during this period.
http://www.nasa.gov/press/2014/october/nasa-study-finds-earth-s-ocean-abyss-has-not-warmed/#.VYFrqPlVikq
No thermal expansion. Zero.
“sunlight warms up waters much deeper than that”
Yes sunlight does.. 😉
But not the mythical CO2 back radiation.
Poor cfnt.. thanks for the laughs.
You mean the easily measurable backradiation is “mythical”? Go over to Roy Spencer’s site, he’s been trying to educate morans on this issue for a looong time.
Nice twist.
CO2 back radiation can not penetrate past a few micrometers. It is the sun that rules the oceans and at 70% of the surface area and the major source of water vapor it is the oceans that rule the climate.
http://www.klimaatfraude.info/images/sverdrup.gif
Here is where your CO2 radiates from actual measurements: (The black dotted line is the tropopause)
http://www2.sunysuffolk.edu/mandias/global_warming/images/stratospheric_cooling.jpg
Paraphrasing Dr. Brown.:
When CO2 near the earth’s surface absorbs back radiation, the lifetime of the excited state caused by the absorption of the photon is much longer than the mean free time between molecular collisions between the CO2 molecule and other molecules in the surrounding gas. That means that the radiative energy absorbed by the molecule is almost never resonantly re-emitted, it is transferred to the surrounding gas, warming not just the CO2 but the oxygen, nitrogen, water vapor, argon as well as the other CO2 molecules around.
In other words near the surface back radiation, aka a ‘resonantly re-emitted’ photon is a RARE EVENT.
Dr Happer in his lecture agreed and further stated that the time to radiate is about ten times slower than the time to the next collision in the troposphere. Dr Happer in his lecture also answered my question about where CO2 energy is radiated instead of being handed off via collision. Experimental data shows barely any radiation at 11 KM and that radiating is in the stratosphere ~ 47 KM above the surface. This is shown in the above diagram from SUNY.
Where the Climate alarmists missed the boat is in using equations for ‘line broadening’ aka the ‘wings’ where the current CO2 absorption ( at 400 ppm) is supposedly taking place. These equations produce results that do not match up to the experimental data. The lines are not as broad as theory would have it and this was the point of the lecture I went to for Physics grad students.
This graph illustrates the ClimAstrologists view that is incorrect according to experimental data.
http://www.realclimate.org/images/CO2Abs4x.jpg
This is the physics background.
The Pound–Rebka experiment (VERY IMPORTANT because gases are moving randomly and in random directions)
Also look at
Mössbauer effect
Motional narrowing
and the Voigt profile.
David Burton put up on his website an audio and slides of Dr Happer’s lecture: link
SLIDES: link
Slides 22, 42, 43 and 44 are the critical slides.
The other associated comments:
Physicist Peter Malcombe link1 and link 2 a more in depth discussion plus the “Robinson and Catling model closely matches data for Titan’s atmosphere”
Physicist Dr. Robert Brown of Duke Univ. link
Gail, that is WAY too much for the little child-mind of the failed junior high student to read, let alone comprehend.
The reality of the science cannot enter his unquestioning tiny mind, only what his priests have told him.
He will just keep posting meaningless little rants without any chance of him ever reaching the truth of the matter. Its all he is capable of.
Andy, I am well aware cfgj is a poorly trained elite serf. I write for the fence sitters who still have brains instead of progressive mush inside their heads.