
In 1982, scientists warned that fossil fuels are melting the Earth’s ice caps.

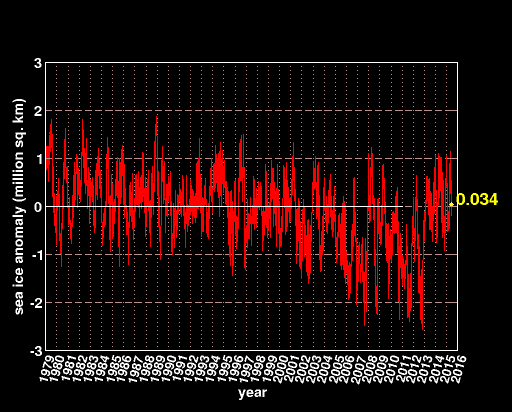
Thirty-three years later, the area of sea ice on Earth is almost exactly the same as 1980
And thirty-three years later, these same geniuses continue to insist that the poles are melting. One might describe climate experts as “terminally stupid”

I would like to tweet this but, the link doesn’t actually give a source.
Of course in 1982 they warned of melting, in 1972 freezing,
There is much evidence that we might have hit a warming peak, which as a whole is much better than freezing. Either way, we are going to need adequate energy to prevent significant human anguish.
Of course, there are the climate elitists who think the human pestilence should be destroyed regardless , Then they live their lives in elegance and daily escapades of frivolity unencumbered by us mortals, whether we be politically correct or incorrect. (color me either depending on the issue, but by far mostly incorrect)
Gail,
Please see my response to your writing on ozone variations as a result of temperature and out of phase EM emissions.
I learned a lot from your contribution.
Makes me wish I could have another go around in education.
darryl,
I am a chemist too but never taught. You do not need to go back to school. Just find a field you like and start reading the papers on the internet.
This paper for example has live links that you can click on to go to other papers.
http://www.ncbi.nlm.nih.gov/pmc/articles/PMC1182327/
And the website has “Related citations in PubMed”
I can spend hours wondering around that website. The biggest problem is it sucks up all your free time. (Luckily I don’t watch TV)
Gail,
I meant I would like to go back as an instructor again.
I occasionally have the opportunity to go into a school for a day or two,
But I was a department chair and a mentor.
I see the stuff come into (some) schools and I cringe.
An example—
I have former students who are teachers using the Al Gore junk.
I have to restrain myself not to chide or embarrass them.
I have to remind them of basic scientific principles and procedures.
The AGW mission creep is remarkable. and as I have state once before on this
blog, all of us blowing each others whistle does nothing.
Our host is doing his job, it is up to us to take the ball and run with it, because for
sure the alarmists, through organizations like the NGO’s are highly organized.
We see marchers, etc warning of coming AGW destruction. Do we see anything
much to the contrary?
My venue was education, so that is where I try to get in my two cents, or three.
Noting that I must arm myself as you do with current information.
It is easier here in Minnesota than say the Northeast U.S. or South California or
in some places like in parts of Australia, the hideout of Cook and the SKS gang. There I have been in contact with Jennifer Marohasy who has been challenging the Australia temp record just as our host has been challenging the U.S. as well as the world records.
Since I do children’s entertainment for fun now that I am retired, I do what I can to get information out on a one on one basis. So far it seems to be working fairly well. I have only run into two of the brainwashed in all these years. The rest grumble about our idiotic government.
It is interesting to see how consensus science changes in response to the political climate. It was on Jan 5, 1972 that Richard Nixon announced he was discontinuing Kennedy’s Apollo Space Program to end the Cold War. laudelafleur.qc.ca/Nomoredreams.html
Henry Kissinger had made that agreement during his secret visit to China in 1971. By 1974, the news media warned a “New Ice Age Is Approaching.” http://content.time.com/time/magazine/article/0,9171,944914,00.html
In 1982, the story had reversed into “Earth’s Ice Caps Are Melting.”
Propaganda artists are busy generating a new scare with each new day.
Link correction: http://laudelafleur.qc.ca/Nomoredreams.html
A strong decline in the galactic radiation during magnetic storm. You can see that the sun protects the earth from dangerous radiation.
http://cosmicrays.oulu.fi/webform/monitor.gif
Click.
Ain’t it funny how that works. The Earths magnetosphere protects us from the harmful solar radition and the solar magnetosphere/influence protects us from galactic radiation/particles. Mean while the gas giant Jupiter acts as a gravitational magnet that helps protect us from impacts from larger threats. Makes me how much our Galaxies influence is protecting us from things extra galactic.
The man was destroying ozone as a result of nuclear tests in the stratosphere. It was a real threat to humanity. Man is not very resistant to ionizing radiation. The ozone layer at a pressure surface of the Earth would have only 3 mm.
Very active spot in front of the Earth.
http://www.spaceweatherlive.com/images/SDO/SDO_HMIIF_512.jpg
I recieved 5 Red Alerts from Rice in the past 24 hours, the most I have ever received in one day.
http://mms.rice.edu/realtime/dials.html
“I get the feeling, and I don’t think that I’m wrong,
Climate scientists just make it up as they go along.
Their story keeps on changing, it’s hard to keep pace,
And we keep on believing, we’re a very strange race……”
http://rhymeafterrhyme.net/climate-science-is-surely-building-its-own-funeral-pyre/
Tomorrow the weather in the eastern quickly to change. Attention to the wind.
http://vortex.accuweather.com/adc2004/pub/includes/columns/newsstory/2015/650x366_06221925_hd28.jpg
http://www.accuweather.com/en/us/national/satellite?play=1
Once it passes over though they will have to have some cooler weather. Very pleasant this early morning in central Indiana with lower humidity and temps in the mid 60s. Much more comfortable than it has been here for several weeks.
It seems that since 2010 the PDO is growing, and AMO decline.
http://woodfortrees.org/plot/jisao-pdo/from:2010/trend:2010/plot/jisao-pdo/from:1980/to:2010/trend/plot/jisao-pdo/from:1980
33 years later and the Greenland and Antarctic ice sheets have started losing mass plus the Arctic sea ice volume has decreased a lot. And don’t even mention the collapsed ice shelves in Antarctica:
– Larsen A ice shelf collapsed in 1995
– Prince Gustav ice shelf also collapsed in 1995
– Larsen B collapsed 2002
– Jones ice shelf collapsed by 2003
– Muller ice shelf collapsed in 2008
– Wilkins ice shelf collapsed partially in 2008
– Wordie ice shelf collapsed in 2008-2009
…some of these had been stable and in place for several thousands of years judged by sediments under them.
Because the temperature increased as a result of high solar activity.
http://www.sidc.be/images/wolfmms.png
Got a reference for that?
cfgj look at the bottom of the graph. It is from the Royal Observatory Belgium. (REN does not speak english)
Yearly mean and monthly smoothed sunspot number
Yearly mean sunspot number (black) up to 1749 and monthly 13-month smoothed sunspot number (blue) from 1749 up to the present.
http://www.sidc.be/images/wolfaml.png
http://www.sidc.be/silso/yearlyssnplot
You could also try reading A History of Solar Activity over Millenniaby Ilya G. Usoskin, Sodankyl ̈ Geophysical Observatory (Oulu unit) University of Oulu, Finland (It cites tons of peer-reviewed papers)
I meant a reference for solar activity causing the recent warming..
The reference for a recent Grand Solar Maximum is in A History of Solar Activity over Millennia by Ilya G. Usoskin. That is why I gave you that as a reference.
You forgot Gail, cfnt cannot read anything more than a couple of sentences long..
There is no way he is capable or reading, let alone understanding that paper.
Casting pearls before swine.
M’ok so if Antarctica and Greenland are losing mass all of a sudden, why didn’t it melt during thousands of years of warmer Holocene? The MWP was 2C warmer, why is 0.8C blamed on humans worse? It’s just such a religious cult.
And why is there absolutely no contribution to sea level rise, which has been steady for decades of observation?
It snows more in Antarctica during warm times, that’s how come the present interglacial hasn’t melted the polar ice sheets. Same for Greenland: more snow accumulation during warm times.
As for ice shelves collapsing…so what? Ice is pushed forward by snow accumulation. The ice will travel a bit faster if there’s more snow. More snow means less sea level rise.
What was the temperature at the poles during the MWP? Currently Arctic has warmed up close to 2C already. Sea-level has been rising without any kind of a hiatus for a long time now and so far the contributions from ice sheets have been quite small.
If an ice shelf was stable and in place for several thousands of years (some people claim at least 10000 years) and then disappear due to melting from both top and bottom, people should at least investigate what is going on.
“Currently Arctic has warmed up close to 2C already”
The DMI graphs clearly show that is, again, total BS.!
I know you have seen them, because I have linked to them before.
So either you are intentionally lying or you are more ignorant than even I thought you were.
The last two summers have had the shortest time just above freezing over the full record since 1958.
Sea levels have risen steadily for a long time, glad you know that much at least.
There is however ZERO acceleration, more probably a deceleration according to the raw unadjusted data.. Its all just a continued natural sea level rise of about 1mm to1.2mm per year.
This means there is NO anthropogenic signal in sea level rise.
“What was the temperature at the poles during the MWP? ”
More than it is now in the Arctic
https://edmhdotme.files.wordpress.com/2015/05/screen-shot-2015-05-25-at-11-09-40.png
Again, you have seen the data before, so you are wilfully ignoring it.
That is called wilful IGNORANCE, or just plain untruthfulness.
There is only one very local part of Antarctica that is melting, and it is being investigated and the most logical reason is volcanic activity. There is no warming above (Antarctic surface temperatures have been steady or slightly declining), and you can see from the massive expanses of unaffected sea ice there is no warming coming from the oceans.
Whatever source of the melting of the Western Peninsula, it sure isn’t even Antarctic wide, let alone global.
An ice shelf is NEVER stable. It can not be due to the nature of glaciers.
Glaciers are rivers of ice and they flow just like a regular river thanks to gravity. The flow rate is dependent on the physical characteristics of the land on which they resat and upon the amount of snow that is deposited on the glacier each year. The more snow the faster a glacier moves due to the increase in weight.
Here are pictures of striations made by the movement of glaciers.
http://upload.wikimedia.org/wikipedia/commons/3/34/Glacial_striation_21145.JPG
http://uwcm-geog.wikispaces.com/file/view/glacialstriations.jpg/467696224/glacialstriations.jpg
INFO on glacier movement in simple terms:
http://uwcm-geog.wikispaces.com/GLACIAL+EROSION
Better information with reference to the Greenland ice cap (page 261): Geologic processes and their results
Chapter V The Work of Snow and Ice starts on page 244
Inauguration of Movement [of glaciers] starts on page 248
(And yes I know it is an old text but decent data/facts do not change.)
year 1999
http://ocean.dmi.dk/arctic/plots/meanTarchive/meanT_1999.png
2000
http://ocean.dmi.dk/arctic/plots/meanTarchive/meanT_2000.png
2001
http://ocean.dmi.dk/arctic/plots/meanTarchive/meanT_2001.png
2002
http://ocean.dmi.dk/arctic/plots/meanTarchive/meanT_2002.png
Paul, don’t you know that only human warming causes ice to melt.
“Currently Arctic has warmed up close to 2C already”
What bull!
The blue line is freezing. All the temperatures in the summer were below normal for the last two years. (melt season has just started so you can not tell for 2015)
2013
http://ocean.dmi.dk/arctic/plots/meanTarchive/meanT_2013.png
2014
http://ocean.dmi.dk/arctic/plots/meanTarchive/meanT_2014.png
All of the summer melt season temperatures when the temperature was above the blue freeze line were either AT or BELOW normal from 1998 on.
Its called “calving”….. FFS, go and learn something.
…. maybe start with how to tie your shoe laces.
Global sea ice levels are way above the short term average.
https://sunshinehours.files.wordpress.com/2015/06/global_sea_ice_extent_zoomed_2015_day_172_1981-2010.png?w=3072&h=2046
Arctic ice thickness is doing very well, thickest since 2006.
https://i2.wp.com/realclimatescience.com/wp-content/uploads/2015/06/Bpiomas_plot_daily_heff.2sst-6-1024×807.png
Glaciers are also recoverning over the long term Andy.
And the same is happening in the Arctic.
Temperature and precipitation history of the Arctic It says: “Solar energy reached a summer maximum (9% higher than at present) ~11 ka ago and has been decreasing since then, primarily in response to the precession of the equinoxes. The extra energy elevated early Holocene summer temperatures throughout the Arctic 1-3°C above 20th century averages, enough to completely melt many small glaciers throughout the Arctic, although the Greenland Ice Sheet was only slightly smaller than at present.”
Another, more recent study in Norway agrees:
The authors of all these papers simply state that most small glaciers likely didn’t exist 6,000 years ago, but the highest period of the glacial increase has been in the past 600 years. This is hardly surprising with ~9% less solar energy.
9% less solar energy translates to ~120 W/m² less solar energy on 21st of June at 65◦ N based on 1,361 W/m² (solar min) and 1362 W/m² (solar max) @ ToA.
And yes I did mean 1,361 W/m²
As someone else said Trenberth and his buddies live on a world that is a flat disk always facing a weak star.
The value of 1150 W/m² at the equator at mid day vs TOA for that day when receiving 1353 W/m² gives a much better idea of how much energy is ‘lost’ before it encounters the oceans at the equator and is absorbed or reflected. ‘Lost’ is being reflected or being available to interact with the upper atmosphere such as forming ozone. In other words at that latitude at midday the atmosphere is pretty darn transparent especially when you consider the chemical reactions taking place in the atmosphere and the fact that some of the incoming radiation is absorbed and transformed in to ‘heat’ – kinetic energy.
Information from link
A bit of an up date over whether MIS 11 is a good analog for the Holocene or if we are looking at heading into the deep freezer. (This is why all the Chicken Little dances over warming would be funny if they were not so dangerous.)
Holocene vs MIS 11
There had been a very intense debate within Quaternary science circles regarding which of the most recent interglacials is the best analogue for the present Holocene. Lisiecki and Raymo, (2005) essentially quashed the Berger and Loutre’s 2002 model and no one has come forward with anything supporting an extended Holocene since then.
Lisiecki and Raymo (Paleooceanography, 2005) produced an exhaustive analysis of 57 globally distributed deep ocean cores reaching back about 5 million years.
Lisiecki and Raymo’s conclusion?
Why is this important?
This is why the amount of solar energy on 21st of June at 65◦ N is calculated and compared in many different papers. MIS-19 which occurred somewhere within or at the Mid Pleistocene Transition, MIS-11 and MIS-1 (the Holocene) all occurred at a 400kyr eccentricity minimum cycle. That is why they are considered analogs and have been studied closely to determine if/when the Holocene interglacial will end in another deep freeze.
MIS 11 (~420,000 BP-~395,000 BP) went long. That is it was a double precession cycle and this is what everyone is hoping for if they have any brains.
There is just one tiny point that most everyone seems to miss — MIS 11 was warmer than the Holocene. Actually all the interglacials over the last half million years were warmer than the Holocene.
http://www.geocraft.com/WVFossils/PageMill_Images/Temp_0-400k_yrs.gif
Collapse of polar ice sheets during the stage 11 interglacial
Here is an open source link for the paper referenced above:
http://www.moraymo.us/Raymo+Mitrovica_2012.pdf
MIS 11, was warmer than the Holocene according to pollen records from Europe, Asia, Australia, New Zealand and America too.
The sea level 20 meters high than today means a lot less sunlight reflected off the ice especially in the SH. What this major change in albedo plus a warmer starting point (with the heat stored in the oceans) means is anyones guess.
OOPS!
Spoke to soon. A new paper as of November 2014
Exceptional Agulhas leakage prolonged interglacial warmth during MIS 11c in Europe
http://onlinelibrary.wiley.com/doi/10.1002/2014PA002665/abstract
They even have a term for it.
“Neoglaciation” started about 3500, years ago
Neoglaciation reached its peak during the LIA, which we have recovered only very slightly from, it is this very slight warming out of the coldest period of the last 10,000 years that all the alarmista hyperventilating is all about.
Quite bizarre really.
We should be highly THANKFUL for that small amount of warming and be hoping that it keeps going!
… some of these had been stable and in place for several thousands of years judged by sediments under them.
Got a reference for that?
Soon the meteorological forecasts will begin with an analysis of solar activity and the stratosphere.
http://www.cpc.ncep.noaa.gov/products/stratosphere/
NOAA Monitors the Stratosphere
NOAA monitors meteorological conditions and ozone amounts in the stratosphere. On this page we present graphics to aid in visualizing the evolution of the South Polar “ozone hole” and factors important for ozone depletion in the polar areas. Several other web pages (see links) discuss the processes of ozone depletion. Here we provide information on the size of the polar vortex, the size of the ozone hole, the size of the area where air is cold enough to form Polar Stratospheric Clouds (PSCs), and which parts of this cold air are sunlit such that photo-chemical ozone depletion processes can occur. In addition, the latitudinal-time cross sections shows the thermal evolution at all latitudes.
Thanks for your reminders that the Sun has dominant control over the climate of planets.
Ice shelfs can be rather stable for millennia, it’s just that many of them were lost in the past 33 years due to melting.
Dinosaurs were stable for millions of years, and are gone now. It’s called “nature”. Ice shelves collapse during interglacials, it is what intelligent people expect to happen.
Stable & solid for 10000 years and suddenly gone after adding some CO2 into the atmosphere? Or only a freak coincidence?
also, the ice shelves were alive and kicking during MWP, but they could not take current conditions.
If I take an ice cube out of a freezer and place it in an 80F room, then an hour later when I turn the thermostat down to 70F, does the ice stop melting?
Why would you assume CO2 is to blame? I already pointed out that ice shelves collapse during interglacials. Or have you forgotten that ice melts when the Earth comes out of an ice age?
Cold water absorbs more CO2 and warmer water absorbs less CO2 and if the water is saturated before cooling it will release CO2. The Ice cores show CO2 lags temperature by about 800 years. The oceans over turn in about 800 years.
Over time the CO2 in the air has been bound as peat and then coal on land or as shells then limestone in the sea. This has left C3 plants over 95% of plant varieties, at the edge of CO2 starvation. Mankind releasing CO2 is saving life on this planet, not destroying it.
From the Royal Society:
Carbon dioxide starvation, the development of C4 ecosystems, and mammalian evolution
Tthis is a water world with 70% of the planet covered in water. The CO2 levels have never been much lower than today and therefore CO2 has been at the ‘saturated’ end of the logarithmic scale during the entire life of the planet. Any effect of CO2 has been in the ‘noise’ range.
https://wattsupwiththat.files.wordpress.com/2010/03/heating_effect_of_co2.png
CO2 over 579 million years: from a revised model of atmospheric CO2 over phanerozoic time (note data is ‘modelled’)
https://i0.wp.com/2.bp.blogspot.com/_cHhMa7ARDDg/SoxiDu0taDI/AAAAAAAABFI/Z2yuZCWtzvc/s1600/Geocarb%2BIII-Mine-03.jpg
Temperature over 65 million years
https://i2.wp.com/jonova.s3.amazonaws.com/graphs/lappi/65_Myr_Climate_Change_Rev.jpg
The earth is getting colder and the CO2 in the atmosphere is being bound up by biochemical/geological processes such as shells ==> limestone, plants ==> peat and coal.
Anyone with any brains would want MORE CO2 to produce MORE food (it is also need to stablize human blood pH)
Anyone with any brains would want a nice warm earth and not an ice box.
Oh, and the atmosphere was probably a lot thicker*** during the time of the dinosaurs and therefore suported the weight of flying dinosaurs and the oxygen needs of the large dinosaurs. It also had more CO2 and therefore supported more plant life. In other words it was a garden of Eden and the Progressives are praying for the ice box of Dante’s lowest level of hell.
***Heavier atmosphere gives warmer temps per lapse rate?
Stable & solid for 10000 years …
Got a reference for that? (Preferably, some sat pics from 10,000 years ago)
fgj says:
June 23, 2015 at 1:56 pm
Stable & solid for 10000 years and suddenly gone after adding some CO2 into the atmosphere? Or only a freak coincidence?
“Suddenly gone”??????????
RAH, The brainwashing is breath taking isn’t it?
It is like cfgj believes CO2 directly melts ice and the ice was not melting at all during the entire length of the Holocene interglacial.
cfgj says:
June 23, 2015 at 11:53 am
I meant a reference for solar activity causing the recent warming..
Maybe you have a weak glasses?
http://woodfortrees.org/plot/pmod/from:1990
The monthly averages are the radio emission from the Sun at a wavelength of 10.7 centimetres averaged over the month. Vertical scale units are in solar flux units (1 sfu = 10-22.m-2.Hz-1), horizontal scale units are in years.
http://www.spaceweather.ca/auto_generated_products/solradmon_eng.png
So how is that causing the recent warming, which is still going on unabated in the seas?
Abstract
The accuracy with which the Argo profiling float dataset can estimate the upper ocean
temperature and heat storage in the North Atlantic is investigated. A hydrographic
section across 36\u0001N is used to assess uncertainty in Argo-based estimates of the
temperature field. The root-mean-square (RMS) difference in the Argo-based temperature
field relative to the section measurements is about 0.6°\u0001C. The RMS difference is smaller,
less than 0.4°\u0001C, in the eastern basin and larger, up to 2.0°\u0001C, toward the western
boundary. In comparison, the difference of the section with respect to the World Ocean
Atlas (WOA) is 0.8\u0001°C. For the upper 100 m, the improvement with Argo is more dramatic,
the RMS difference being 0.56\u0001° C, compared to 1.13\u0001C with WOA. The Ocean
Circulation and Climate Advanced Model (OCCAM) is used to determine the Argo
sampling error in mixed layer heat storage estimates. Using OCCAM subsampled to
typical Argo sampling density, it is found that outside of the western boundary, the mixed
layer monthly heat storage in the subtropical North Atlantic has a sampling error of
10–20 Wm 2 when averaged over a 10\u0001 \u0002x 10\u0001 area. This error reduces to less than
10 Wm 2 when seasonal heat storage is considered. Errors of this magnitude suggest that
the Argo dataset is of use for investigating variability in mixed layer heat storage on
interannual timescales. However, the expected sampling error increases to more than
50 Wm 2 in the Gulf Stream region and north of 40\u0001N, limiting the use of Argo in these
areas.
So where are you finding warming, and exactly how much?
http://www.sciencebits.com/sites/default/files/pictures/research/calorimeter/calorimeter2.gif
Sea Level vs. Solar Activity. Sea level change rate over the 20th century is based on 24 tide gauges previously chosen by Douglas [1997] for the stringent criteria they satisfy (solid line, with 1-σ statistical error range denoted with the shaded region). The rates are compared with the total solar irradiance variations Lean [2000] (dashed line, with the secular trends removed).
http://www.sciencebits.com/sites/default/files/pictures/research/calorimeter/calorimeter1.gif
Sea Surface Temperature anomaly, Sea Level Rate, Net Oceanic Heat Flux, the TSI anomaly and Cosmic Ray flux variations. In the top panel are the inverted Haleakala/Huancayo neutron monitor data (heavy line, dominated by cosmic rays with a primary rigidity cutoff of 12.9 GeV), and the TSI anomaly (TSI – 1366 W/m2 , thin line, and based on Lean [2000]). The next panel depicts the net oceanic heat flux, averaged over all the oceans (thin line) and the more complete average heat flux in the Atlantic region (Lon 80°W to 30°E, thick line), based on Ishii et al. [2006]. The next two panels plot the SLR and SST anomaly. The thin lines are the two variables with their linear trends removed. In the thick lines, the ENSO component is removed as well (such that the cross-correlation with the ENSO signal will vanish).
FROM: Nir J. Shaviv (2008); Using the oceans as a calorimeter to quantify the solar radiative forcing, J. Geophys. Res., 113, A11101, doi:10.1029/2007JA012989
Do not forget about ocean circulation. In some regions of ocean is still warms, for example, the Indian Ocean, where there is strong magnetic fields (less of ionizing radiation).
http://www.esa.int/var/esa/storage/images/esa_multimedia/images/2014/06/magnetic_field_changes/14582172-1-eng-GB/Magnetic_field_changes_large.jpg
Text to go with REN’s image.
“which is still going on unabated in the seas.”
More utter BS !!! stop the mis-information, unlock your brain from its propaganda stupor and READ and try to comprehend all the data that says .. NO IT IS NOT !!
Meanwhile Arctic Ice is Surging back to 2014 rate:
https://rclutz.files.wordpress.com/2015/06/masie-day-173.jpg
https://rclutz.wordpress.com/2015/06/23/surge-in-arctic-ice-2015-gains-on-2014/
cfgj keeps saying the oceans have continued to warm. So here is an interesting comment by Dr. Niv Shaviv (physicist) on the global warming “hiatus” disappearing act preformend by NOAA/NASA at the direction of Obama.
http://www.sciencebits.com/files/pictures/climate/warming-vs-altitude.jpg
Looks like NOAA/NASA are going to get themselves into a major tangle over their re-writing history since more and more scientists now view them as corrupt and not as sitting on a pedestal.
Sinister conspiracy at work again? Isn’t it weird that there’s no evidence of data having been tampered with fraudulently? The conspirators must be really good!
“Isn’t it weird that there’s no evidence of data having been tampered with fraudulently?”
Given that there are currently at least two investigations into the “homogenisation” of the surface temperature datasets, with specific reference as to why they appear to be heavily divergent from the satellite data – one by the US Government, that is not a supportable statement.
But there again, none of your statements ever are, of course.
https://media2.stickersmalin.com/produit/100/stickers-devil-smile-R1-143760-2.png
If an accountant ever did to the ledgers what NASA/NOAA (and CRU) has done to the original temperature data, they would be hung out to dry….
OH WAIT — ENRON
And from another lawyer we find ENRON setting up the CAGW scam.
If you do not understand this E. M. Smith, an economist by training explains it: “Evil Socialism” vs “Evil Capitalism”
and so does Mother Jones ADM’s bottom line has always been interwoven with public policy. To reinforce this relationship, Andreas has contributed impressively to the campaigns of politicians, from Richard Nixon and Hubert Humphrey to Bill Clinton and Bob Dole.
According to PBS, Archer Daniels Midland Co.’s CEO, Dwayne Andreas is Perhaps America’s champion all-time campaign contributor “…Although virtually unknown to most Americans, since the 1970s, leading politicians of both parties have been well acquainted with Andreas, his company, and his money….”
It is much easier and cheaper to buy politicians than it is to pay for innovation and research. Much less of a gamble too.
No
Just mega-corporations pulling their usual stunt of buying politicians to force the public to shellout money to buy inferior products. Happens all the time and is the primary business plan of the 21st century.
Why gamble on research when you can legislate a captive audience that has to buy your shoddy crap. Think of mercury filled twisty light bulbs that not only don’t live up to the hype but are now flooding land fills with mercury.
If you had actually been paying attention you would have seen that Tony provides such evidence here all the time. Go back and check the archives and you will find plenty of it. Oh and recently WUWT that has had some posts on data tampering too? I bet you believed Obama when he talked about “Shovel Ready Jobs” and all these promises too!
Reblogged this on Centinel2012 and commented:
The question is than how will NOAA and NASA hide that?